
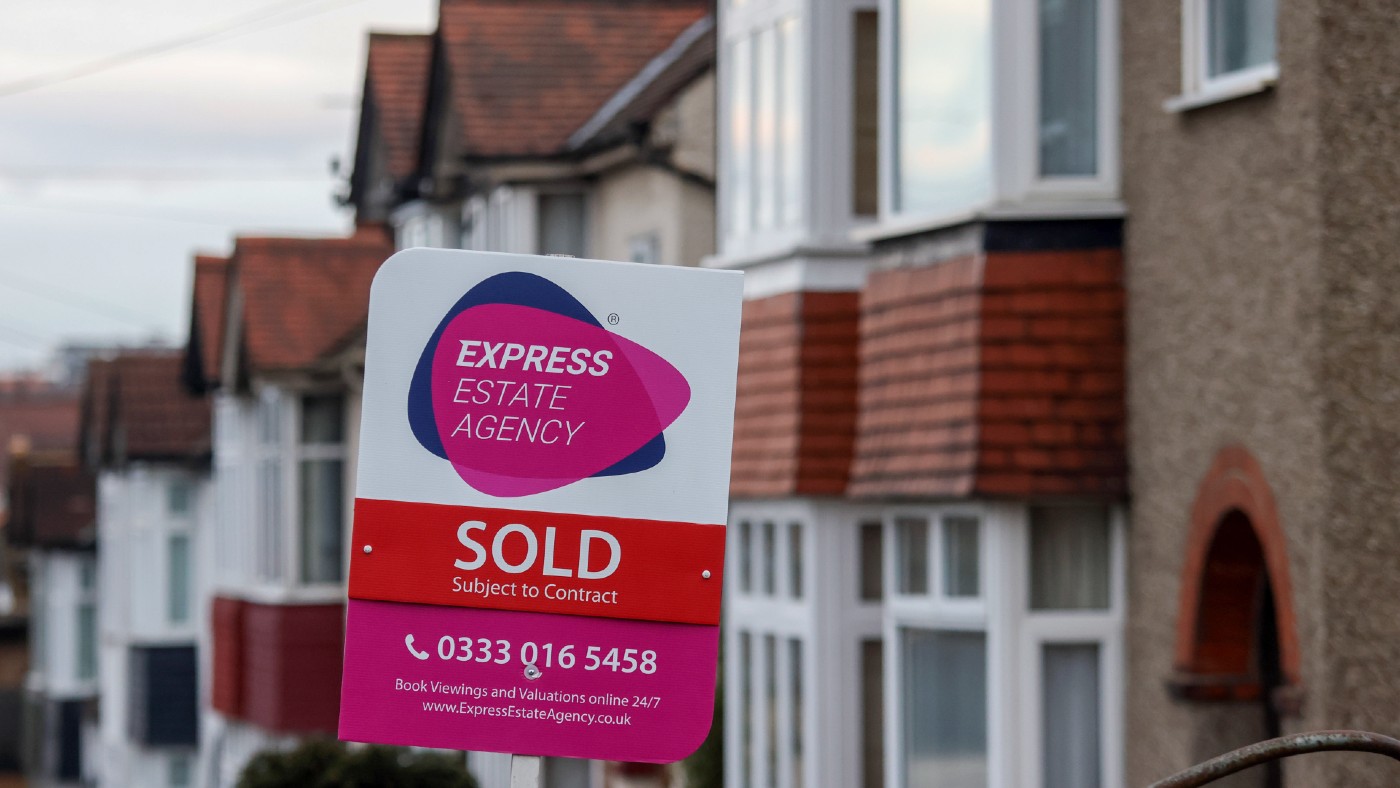
Properties in Greater London cost in excess of £210,000 more on average than homes in the next most expensive UK region despite nationwide price rises over the past year, newly released figures show.
The average asking price in the English capital and surrounding area is £612,465, followed by the South East at £400,150, according to Rightmove’s latest house price index.
Subscribe to The Week
Escape your echo chamber. Get the facts behind the news, plus analysis from multiple perspectives.

Sign up for The Week's Free Newsletters
From our morning news briefing to a weekly Good News Newsletter, get the best of The Week delivered directly to your inbox.
From our morning news briefing to a weekly Good News Newsletter, get the best of The Week delivered directly to your inbox.
| British regional house price changes | |||
| Region | Avg. price January 2020 | Monthly change | Annual change |
| Greater London | £612,465 | 2.1% | 3.1% |
| South East | £400,150 | 1.7% | 2.6% |
| East of England | £350,607 | 2.7% | 1.8% |
| South West | £303,373 | 1.7% | 2.1% |
| West Midlands | £230,222 | 2.6% | 4.2% |
| East Midlands | £230,207 | 1.5% | 3.8% |
| North West | £196,537 | 1.1% | 1.7% |
| Wales | £193,106 | -0.9% | 2.6% |
| Yorks. & Humber | £190,579 | 0.1% | 0.5% |
| Scotland | £149,664 | -0.8% | 1.6% |
| North East | £148,068 | 1.3% | 1.1% |


-
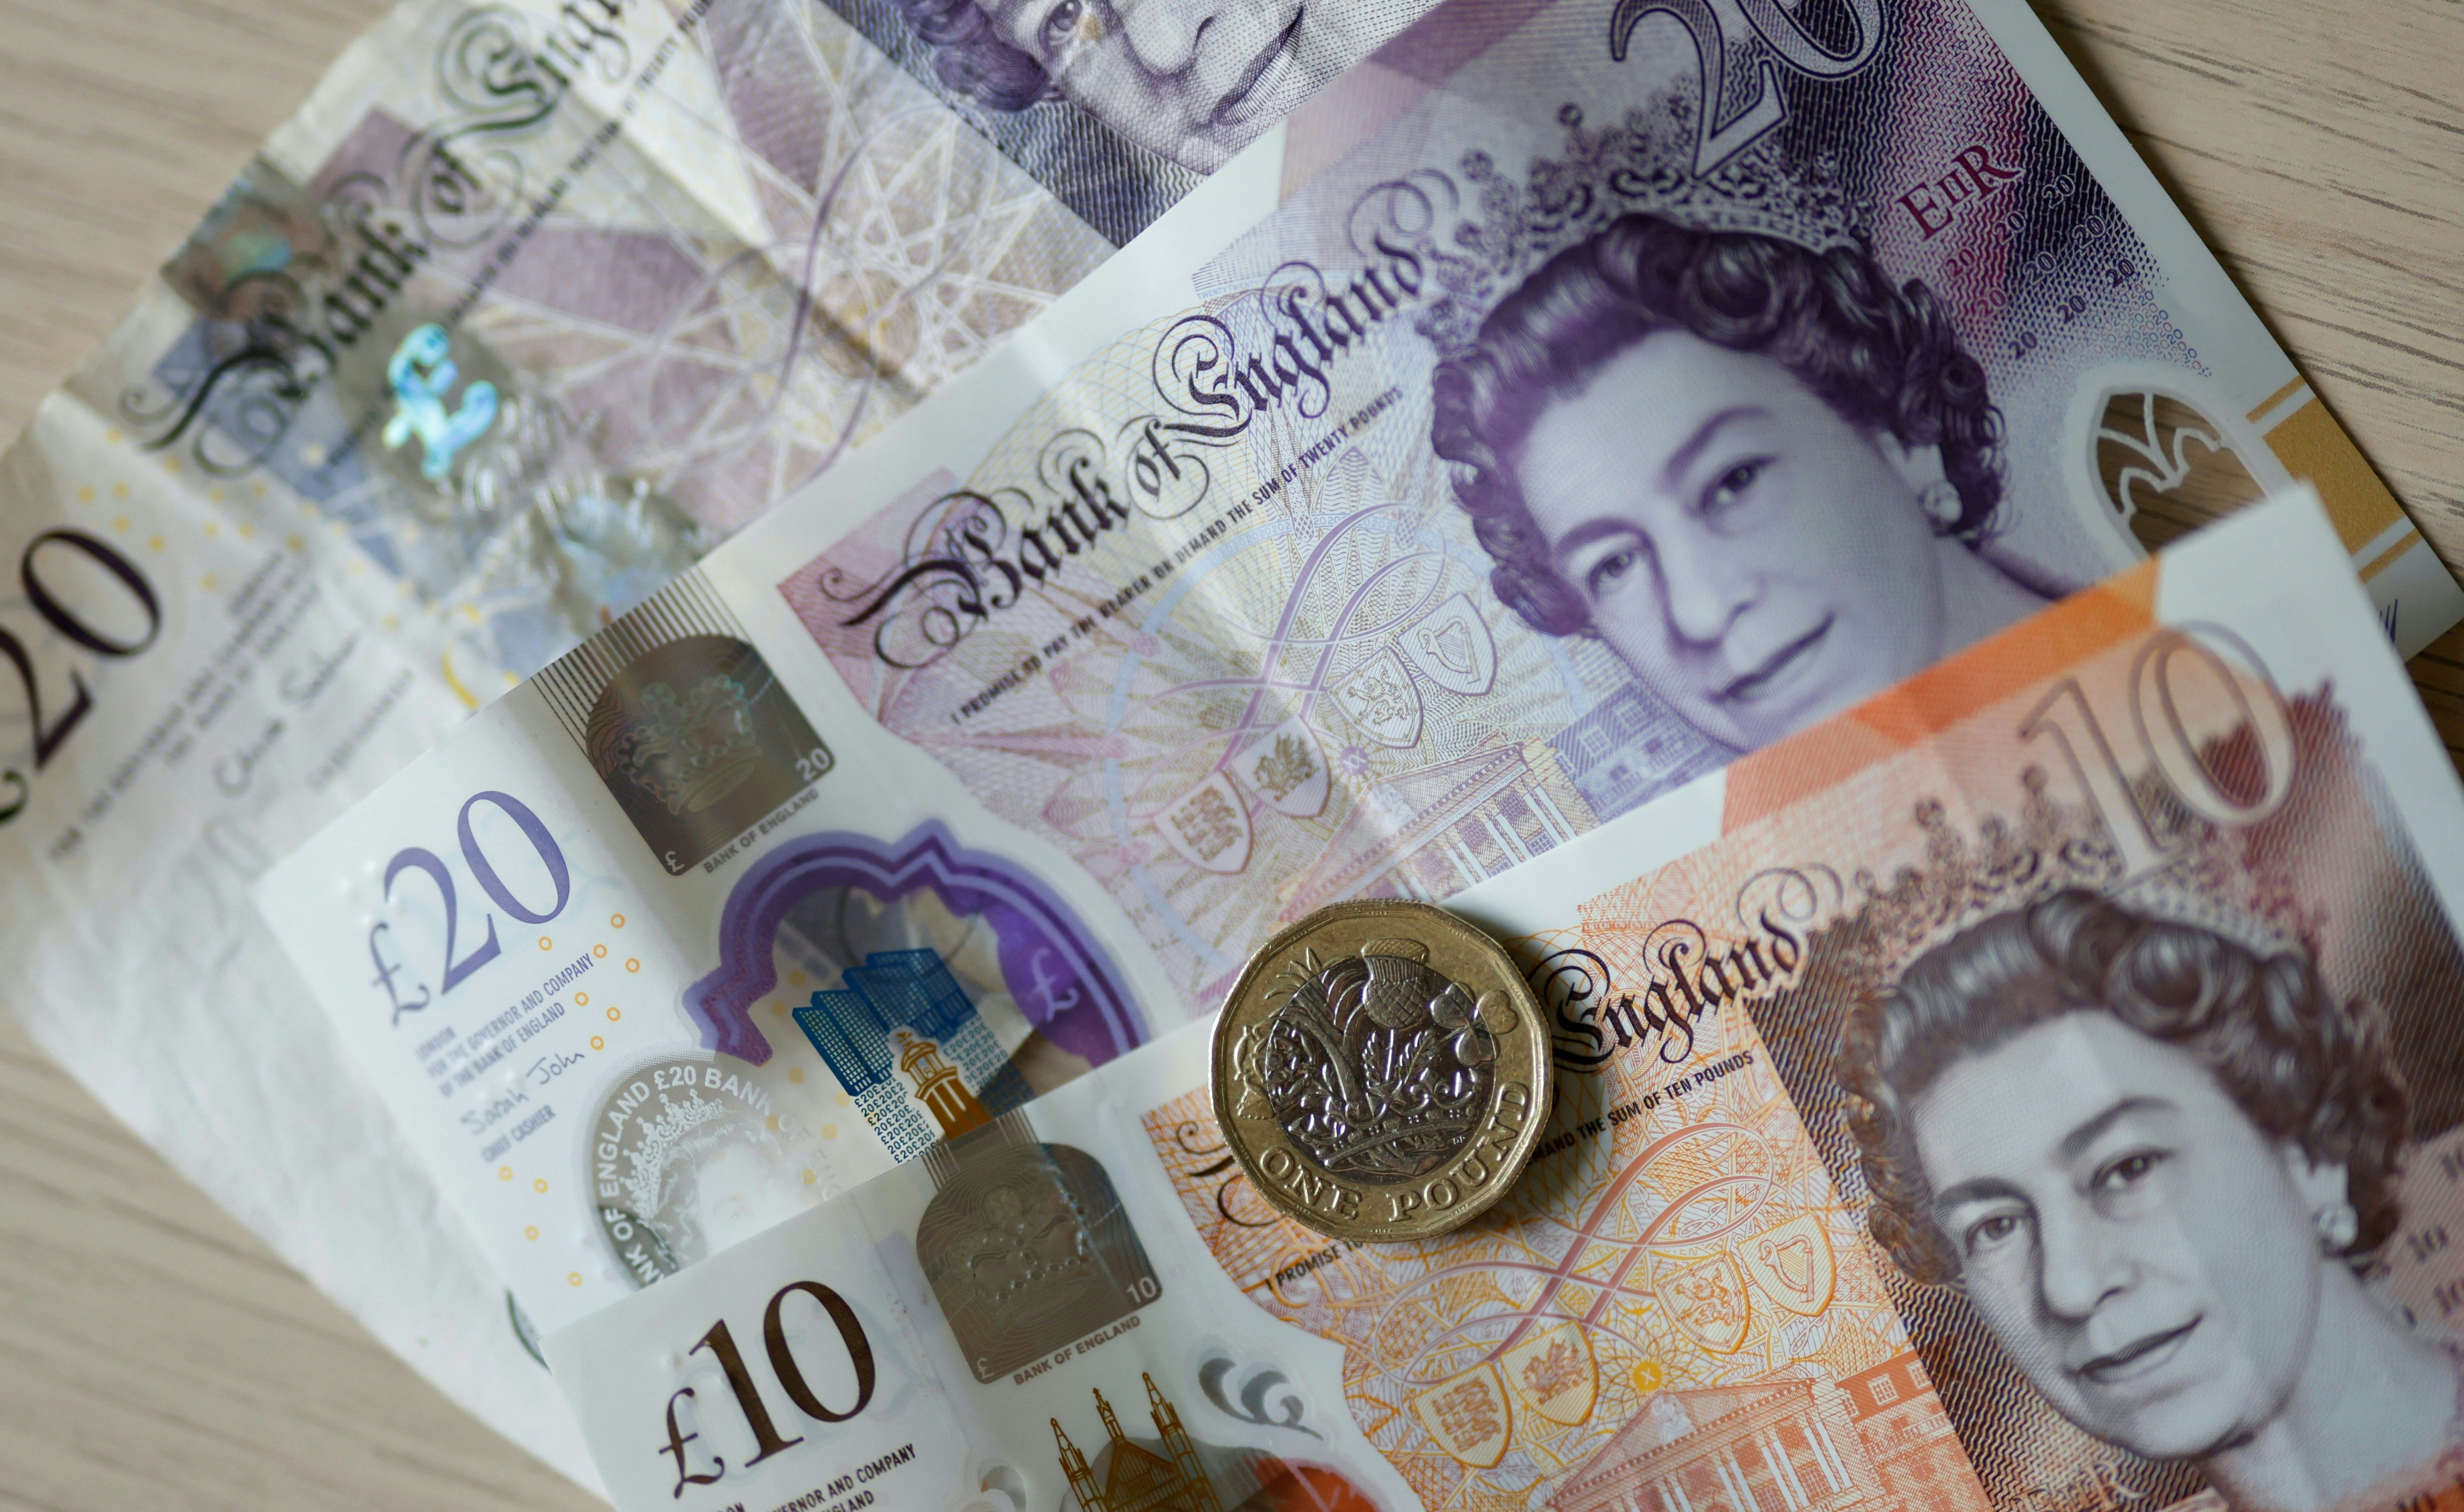
 UK house prices fall at fastest rate for nearly 14 years
Speed Read First-time buyers may welcome the news but higher than expected inflation means mortgage costs remain an issue
-
 The cost-of-living support available from government
feature Downing Street says no further measures will be rolled out before new PM is in place
-
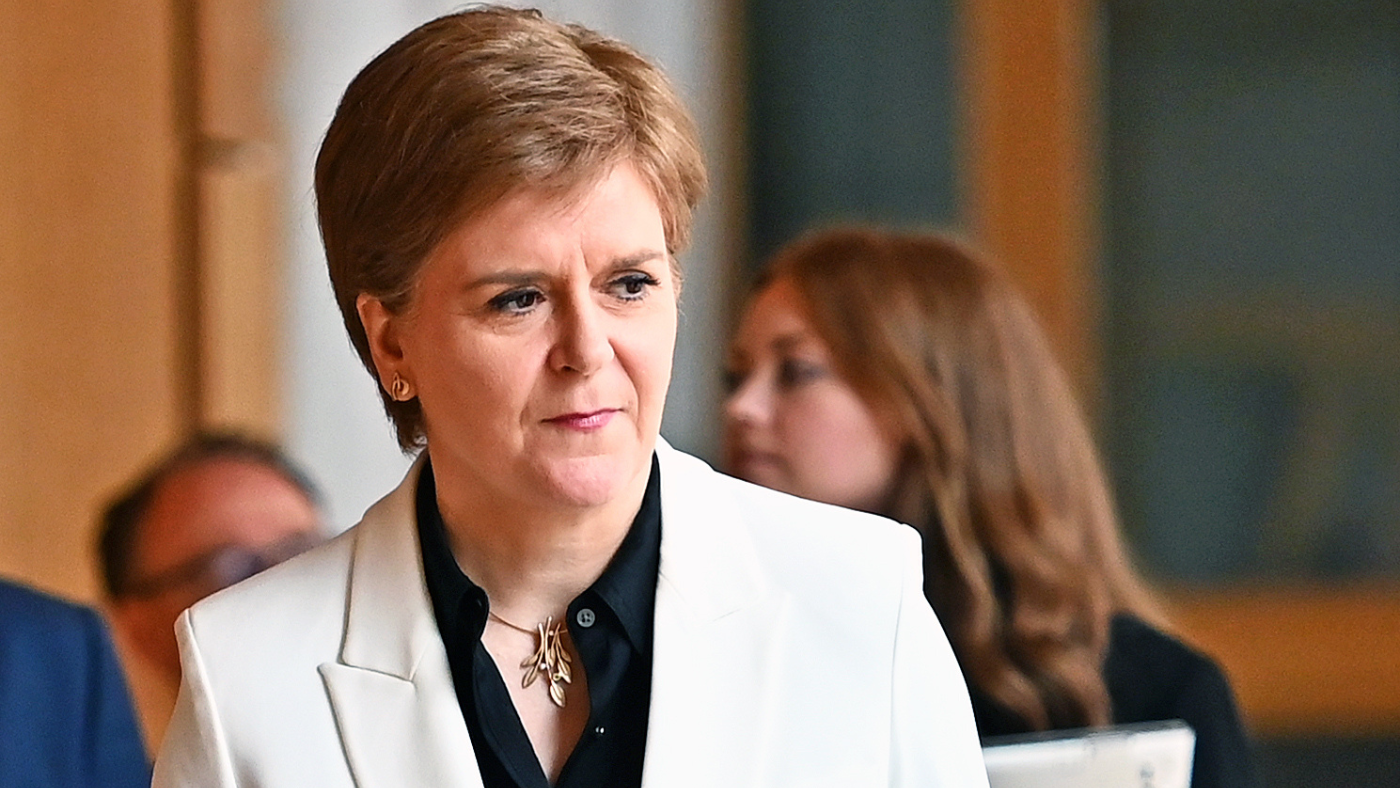 The road to a second Scottish independence referendum
feature Nicola Sturgeon launched her latest bid for Scottish independence last week
-
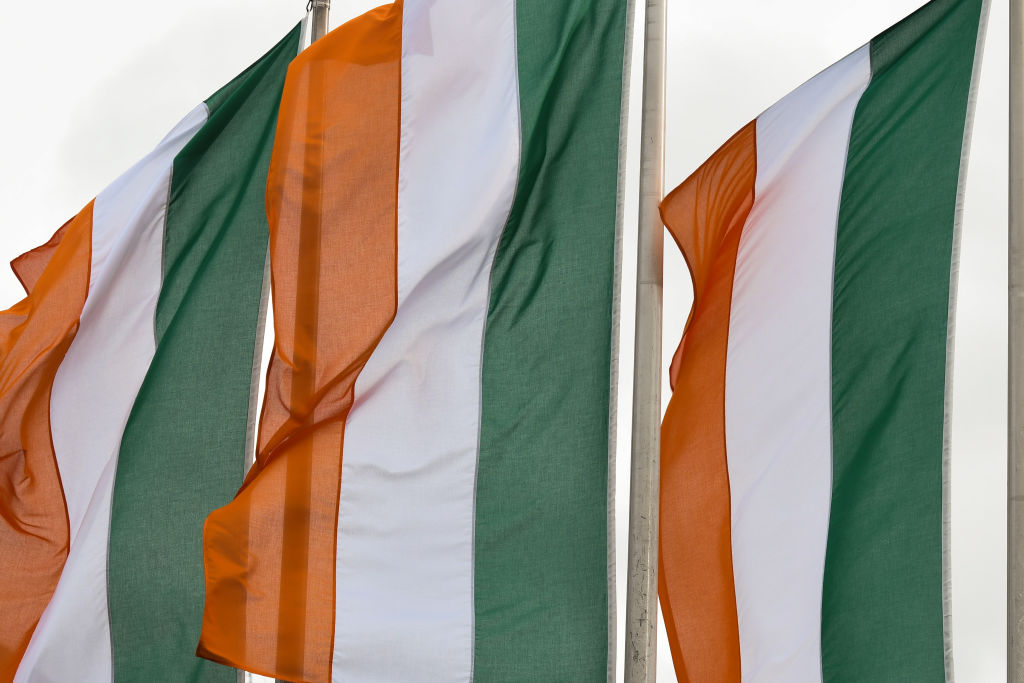 What Scotland can learn from Irish independence
feature Economists predict Scottish transition would fail to curb increasing interest rates and inequality
-
 Scotland’s ongoing ferry fiasco: what you need to know
In Depth Delays in the delivery of two new CalMac passenger ferries have caused a major political scandal
-
 Why the government opposes a windfall tax on oil and gas profits
feature BP profit surge triggers renewed calls for a levy to help struggling households
-
 Will Britain fall into a recession this summer?
Today's Big Question Spiralling cost of living comes after the Russian invasion of Ukraine
-
 Does Saudi Arabia hold the key to lower energy prices?
Today's Big Question Boris Johnson due to visit Riyadh for talks as the UK seeks to reduce Russian energy imports


